For years, rural areas across the nation have struggled to provide residents and businesses with the latest broadband internet technology and communication technologies. West Central Texas is no exception. Residents are increasingly reliant on fast and efficient internet access for everything from VOIP telephone service and cable service, to simple access to information and commerce. Similarly, businesses rely on the latest communication services to stay connected to an increasingly global marketplace, and remain competitive with other regions in a 'world is flat' economy where you're competing outside of traditional geographic boundaries. Likewise, communities rely on such service for instant emergency communication, and increasingly for telemedicine and e-learning.
In a 2010 study conducted by the West Central Texas Economic Development District (WCTEDD), when queried regarding their access to the community’s broadband internet services, 79.4% of respondents indicated yes, 13.2% indicated no, and 7.4% were uncertain. The 2010-15 CEDS noted, that “this lack of connectivity throughout the region will remain a significant barrier to continued economic development until this issue is resolved.” The CEDS further noted that “once rectified, enhanced emergency response for residents, increased levels of economic development, educational access benefit from a level communication and technology playing field.”
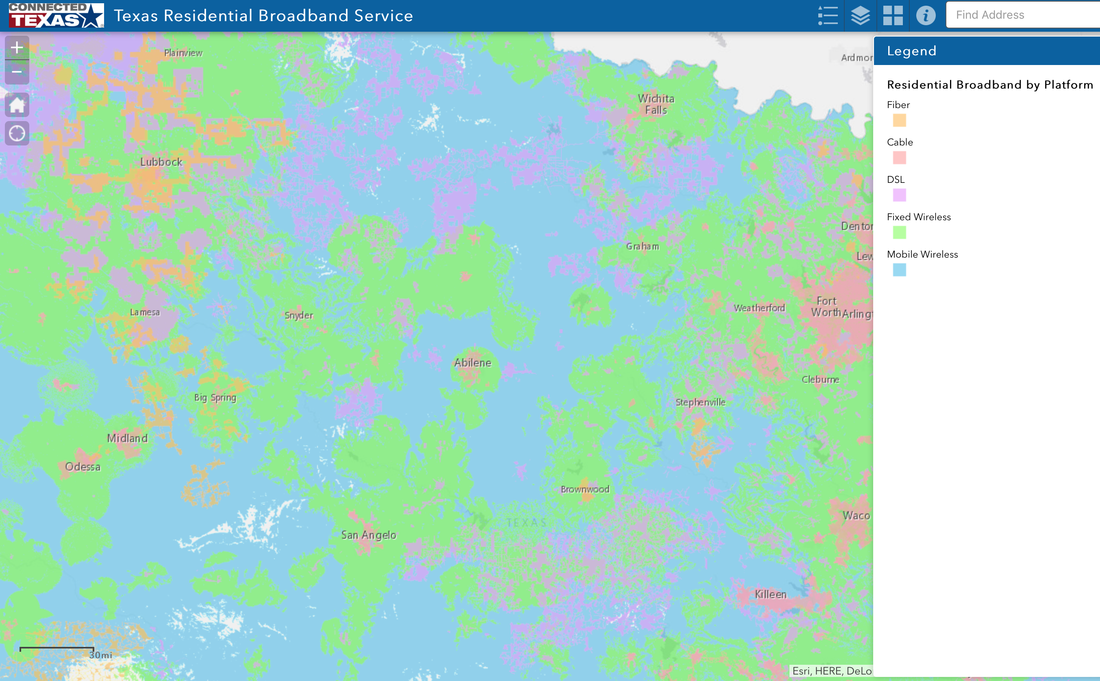
Analysis of the current connectivity of the region suggests significant gains have been made in the effort to ensure the latest telecommunications capabilities for the region. According to Connected Texas, an independent public/private initiative working to ensure that all can experience the benefits of broadband, the major population centers in the region are now well covered with broadband coverage. Abilene, Brownwood, Snyder, Sweetwater, and Breckenridge are characterized by ‘broadband fiber’ coverage (Breckenridge is supplemented with areas of only ‘DSL’ coverage). Coleman, Ballinger, Colorado City, and Comanche have ubiquitous ‘DSL’ coverage, with areas of ‘fixed wireless’ coverage surrounding the communities in the more rural areas.
In a 2010 study conducted by the West Central Texas Economic Development District (WCTEDD), when queried regarding their access to the community’s broadband internet services, 79.4% of respondents indicated yes, 13.2% indicated no, and 7.4% were uncertain. The 2010-15 CEDS noted, that “this lack of connectivity throughout the region will remain a significant barrier to continued economic development until this issue is resolved.” The CEDS further noted that “once rectified, enhanced emergency response for residents, increased levels of economic development, educational access benefit from a level communication and technology playing field.”
Analysis of the current connectivity of the region suggests significant gains have been made in the effort to ensure the latest telecommunications capabilities for the region. According to Connected Texas, an independent public/private initiative working to ensure that all can experience the benefits of broadband, the major population centers in the region are now well covered with broadband coverage. Abilene, Brownwood, Snyder, Sweetwater, and Breckenridge are characterized by ‘broadband fiber’ coverage (Breckenridge is supplemented with areas of only ‘DSL’ coverage). Coleman, Ballinger, Colorado City, and Comanche have ubiquitous ‘DSL’ coverage, with areas of ‘fixed wireless’ coverage surrounding the communities in the more rural areas.
Find your community's download speeds at http://www.broadbandmap.gov/speed
WCTEDD and communities throughout the region, however, must continue to focus on providing the latest communication service and technologies to residents and businesses. In recent surveys by Connected Texas:
See the table below for detailed connectivity data by county for the WCTEDD region (source: Connected Texas, http://www.connectedtx.org/sites/default/files/facts-figures/files/tx_nov_2014_table_5.pdf)
- 80% of Texas businesses use broadband every day
- 40% of Texas businesses that want faster internet cannot get it
- 296k Texas businesses don't have backup internet service
- 62% Texas residents ‘use broadband from home’
- 12% of Texas residents without broadband cited ‘broadband not available in my area’ as a reason for lack of use
See the table below for detailed connectivity data by county for the WCTEDD region (source: Connected Texas, http://www.connectedtx.org/sites/default/files/facts-figures/files/tx_nov_2014_table_5.pdf)
Table: 2014 Estimated Availability of Broadband Service by County (Terrestrial Broadband, excluding mobile)
County |
Household Density |
# Households |
> 768 Kpbs / 200Kbps upload speeds |
> 3 Mbps Download / 768 Kpbs Upload |
> 6 Mbps Download / 1.5 Mpbs Upload |
Brown |
15.4 |
12,778 |
98.82 |
96.89 |
92.43 |
Callahan |
6.0 |
5,447 |
94.31 |
74.83 |
8.55 |
Coleman |
3.0 |
3,857 |
96.68 |
54.42 |
0.86 |
Comanche |
5.9 |
5,580 |
97.86 |
74.07 |
0.48 |
Eastland |
8.0 |
7.465 |
96.33 |
95.35 |
38.53 |
Fisher |
1.8 |
1,668 |
94.31 |
93.44 |
89.57 |
Haskell |
2.5 |
2,297 |
99.97 |
99.97 |
79.32 |
Jones |
6.4 |
6,034 |
97.07 |
64.58 |
63.65 |
Kent |
0.4 |
350 |
95.52 |
93.94 |
35.90 |
Knox |
1.8 |
1,506 |
100.00 |
100.00 |
53.16 |
Mitchell |
3.1 |
2,809 |
99.86 |
99.82 |
0.00 |
Nolan |
6.6 |
5,999 |
99.62 |
96.14 |
86.49 |
Runnels |
3.9 |
4,165 |
99.51 |
95.02 |
81.63 |
Scurry |
6.4 |
5,838 |
99.55 |
97.08 |
97.05 |
Shackelford |
1.5 |
1,367 |
87.59 |
17.40 |
3.27 |
Stephens |
4.0 |
3,665 |
95.42 |
90.21 |
65.00 |
Stonewall |
0.7 |
642 |
97.19 |
96.36 |
93.44 |
Taylor |
55.2 |
50,725 |
100.00 |
97.15 |
94.16 |
Throckmorton |
0.8 |
721 |
82.23 |
79.66 |
29.93 |